


The stock market has been on quite the rollercoaster of late, thanks to news headlines. But investors seem to have shrugged off the past weekend’s geopolitical tensions, at least for now.
On Tuesday, we saw a surge of enthusiasm. Investors were diving back into stocks and selling off their oil and precious metals holdings. Last week, oil prices spiked amid Middle East tensions, but have now fallen to pre-conflict levels. After what felt like a few weeks of the market moving sideways, maybe the stock market got the catalyst it needed to push the major indexes out of their trading range. A ceasefire between Israel and Iran was enough to get things going.
Stocks Get a Boost
Tuesday’s positive tone helped move the stock market higher, with the S&P 500 ($SPX) closing up 1.1%, finally breaking above the top of its trading range. The Nasdaq Composite ($COMPQ) followed suit, with both indexes within spitting distance of their all-time highs. The Nasdaq 100 ($NDX), which closed 1.53% higher, hit a new all-time high. And let’s not forget the Dow Industrials ($INDU), which is also making a strong attempt to push through key resistance levels, even though it’s a little bit further from its all-time high.
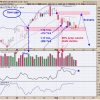
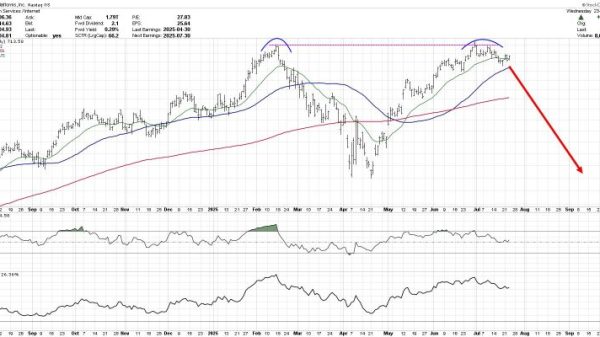
Given the Nasdaq 100’s strong performance on Tuesday, it’s worth taking a closer look at the daily chart of the Invesco QQQ Trust (QQQ).
FIGURE 1. DAILY CHART OF QQQ. The ETF hit a new high on June 24 with a potential Golden Cross. If the relative strength index and percentage price oscillator confirm upside momentum, QQQ could rise higher.Chart source: StockCharts.com. For educational purposes.
Besides hitting a new high, note that the 50-day simple moving average (SMA) crossed above the 200-day SMA. This is referred to as a Golden Cross and can be an early sign of bullishness. While it’s not a guaranteed “green light” at such an early stage, it’s worth watching to see if the 50-day SMA continues to stay above the 200-day SMA.
The relative strength index (RSI) is getting closer to overbought territory. If it crosses above 70, it would be another sign of strong bullish momentum. Similarly, the percentage price oscillator (PPO) needs to move into positive territory, meaning the shorter moving average should cross above the longer one. They’re close, but remember these are lagging indicators, meaning they’ll confirm trends that are already underway. Thus, if the 50-day SMA remains above the 20-day SMA, RSI crosses above 70, and PPO confirms upside momentum, it would confirm further upside move in QQQ.
Another interesting point to note: The Cboe Volatility Index ($VIX) closed at 17.48, which suggests investors are relatively complacent. The VIX was relatively subdued during the Middle East conflict, hitting a high of around 22. With less fear, the charts of the major indexes look like they’re going to hit fresh highs. On Tuesday, Technology, Financials, and Communication Services were the top-performing sectors.
Tech Regains Lead
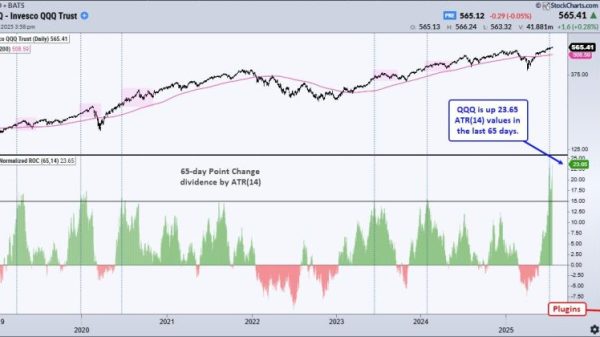
The Technology sector was powered by semiconductors, which have been driving the market lately. The VanEck Vectors Semiconductor ETF (SMH) has broken above the range it’s been trading within for the last couple of weeks and is now close to its 52-week high (see daily chart of SMH below).
FIGURE 2. DAILY CHART OF SMH. Semiconductors have been driving the stock market lately and broke out above the range from the last couple of weeks.Chart source: StockCharts.com. For educational purposes.
Looking at individual stocks, NVIDIA Corp. (NVDA) was the most actively traded S&P 500 stock. A handful of big names are hitting new all-time highs, too; this includes Broadcom, Inc. (AVGO), Cisco Systems, Inc. (CSCO), International Business Machines (IBM), JP Morgan Chase (JPM), Microsoft Corp. (MSFT), and Netflix Inc. (NFLX), just to name a few. For the complete list, check out the “New Highs” panel in your StockCharts Dashboard; you’ll likely notice a significant percentage of tech stocks on the list.
The positive price action on Tuesday suggests investors are rotating into growth stocks, which signals further upside moves in the S&P 500 and Nasdaq stocks. Here’s a more encouraging sign: even the S&P 500 Equal-Weighted Index ($SPXEW) is breaking out and moving towards its highs. This indicates that the market’s strength isn’t limited to a few big, heavily-weighted growth stocks; participation is much broader.
Travel Stocks Get a Lift
Beyond tech stocks, consumer discretionary stocks also traded higher. The top three performers in the Consumer Discretionary sector were Carnival Corp. (CCL), Norwegian Cruise Lines Holdings (NCLH), and Caesars Entertainment (CZR). The MarketCarpet for the Consumer Discretionary sector below shows travel stocks were strong performers on Tuesday.
FIGURE 3. MARKETCARPET FOR THE CONSUMER DISCRETIONARY SECTOR. The table on the right shows CCL, NCLH, and CZR were the top performers.Image source: StockCharts.com. For educational purposes.
CCL’s stock price gapped up after the company reported strong earnings and guidance. An increase in cruise line bookings indicates consumer sentiment is strong. As a result, cruise lines and travel stocks traded higher. This goes against June’s Consumer Confidence report, which showed weakening confidence. It didn’t seem to impact the market, but it may come back to bite us depending on what news headlines we are likely to receive on Wednesday.
Closing Position
Tuesday’s price action suggests that equities are back on their bullish track after a period of consolidation. Will the upside move hold, or will a negative news headline bring the bears back into the market?
This is where your StockCharts tools come in handy! Keep a close eye on the performance of the major indexes and other helpful indicators such as the RSI and PPO. By using these tools, you can stay on top of the stock market and make investment decisions with greater confidence.
Disclaimer: This blog is for educational purposes only and should not be construed as financial advice. The ideas and strategies should never be used without first assessing your own personal and financial situation, or without consulting a financial professional.