


The market does not always follow the same script or sequence, but bear markets typically end with a bottoming process marked by specific stages. These include capitulation, a short-term reversal-thrust, a follow-through thrust and long-term regime change. The first two stages mark downside excess and the initial turn around, while the latter two signal strong follow through. Today’s report will look at the first two phases, and preview the last two.
Phase 1: Capitulation
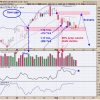
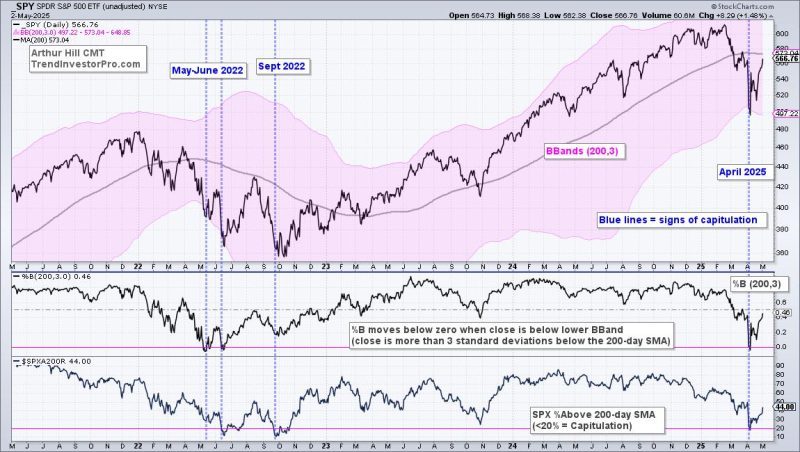
The capitulation phase of a bear market occurs when traders throw in the towel as downside momentum and selling pressure accelerate. Usually, the capitulation phase occurs after an extended decline, and this phase is the first step to a bottom. The chart below shows SPY with Bollinger Bands (200,3), %B (200,3) and S&P 500 Percent Above 200-day SMA ($SPXA200R). Signs of capitulation emerge when %B is below 0 and/or fewer than 20% of S&P 500 stocks are above their 200-day SMAs. The blue dashed lines show capitulation in June 2022, September 2022 and early April 2025. Note that we initially covered this capitulation phase in a report on April 8th.
Phase 2: Short-term Thrust Signals (ZBT)
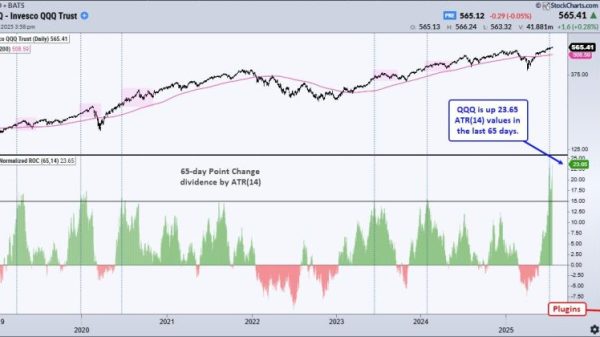
Phase 2 is marked by a sharp-reversal from oversold extremes and an upside thrust. The Zweig Breadth Thrust is perhaps the most famous thrust indicator these days. We covered the ZBT extensively over the last few weeks and introduced a strategy using this indicator. The chart below shows the S&P 1500 ZBT indicator in the lower window (10-day EMA of S&P 1500 AD%). A thrust signal triggered on April 24th and stocks followed through with further gains.
Two Down and Two to Go
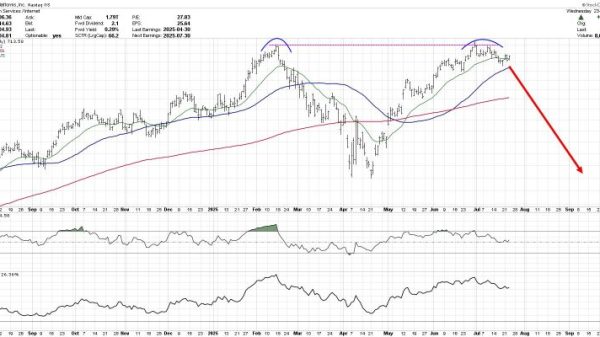
The capitulation phase showed excessive selling pressure and the thrust phase marked a short-term reversal. These are bullish events, but the market cup is not yet half full. SPY remains below its 200-day SMA and the late March high (see chart above). Medium-term thrust indicators have yet to trigger and long-term breadth remains bearish. The 14% surge over the last 17 days is impressive, but keep in mind that SPY surged 10% in nine days in March 2022, which was a bear market bounce.
TrendInvestorPro produced a report this week covering the four phases – and what to watch going forward. Click here to take a trial and get immediate access.
Phase 1: Capitulation
Phase 2: Short-term Thrust Signals
Phase 3: Medium-term Thrust Signals
Capitulation and Thrust Indexes
Phase 4: Long-term Indicators turn Bullish
Short-term Improvements, but Longer Term
//////////////////////////////////////////////////////