


This week, the market appeared to shift dramatically from “stalling out at all-time highs” to more of a “big time risk-off selloff move” kind of situation. The warning signs were building in August, but, so far, September is ringing all kinds of market topping alarm bells. Let’s review three key charts that tell the story of this shift in investor sentiment.
Weaker Momentum Indicates Bulls are Exhausted
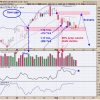
When the S&P 500 first tested the 5650 level in July, the daily RSI pushed above 80 to reinforce the strong positive momentum. Then, when that level was retested in late August, the RSI was down around 60.
What appeared to be a potential pause before an upside breakout now seems to be a confirmed double top pattern with weakening momentum characteristics. This suggests an exhaustion of bullish sentiment and looks awfully similar to previous market tops.
Looking for help navigating what will most likely be a turbulent September and beyond? Our Market Misbehavior premium membership could be the answer. From our Weekly Flight Plan report to virtual courses on technical analysis and an interactive members-only community, we’re ready to help you upgrade your market awareness! Sign up today and use code DK2024 for 30% off your first 12 months on any plan!
To be clear, the S&P 500 still remains within 5% of an all-time high. But with the SPX down over 4% this week, and the Nasdaq 100 down almost 6%, bears appears to be back in control of the major market averages.
Elevated Volatility Implies Elevated Risks
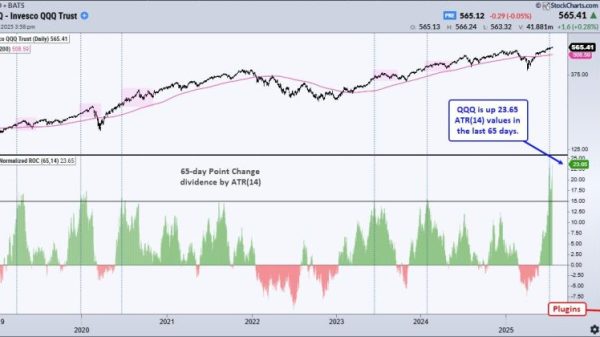
I was super surprised to see the VIX come back down to the mid-teens in mid-August after spiking to one of its highest levels in history. Through late August, the VIX remained below the 20 level, suggesting a low-volatility environment.
This week, the VIX pushed back above that crucial 20 level, signaling elevated uncertainty and therefore elevated risk for stocks. Every day the VIX remains above 20 should give less comfort to bulls cautiously looking for a dramatic upside reversal.
Newer Dow Theory Flashes Bearish Non-Confirmation
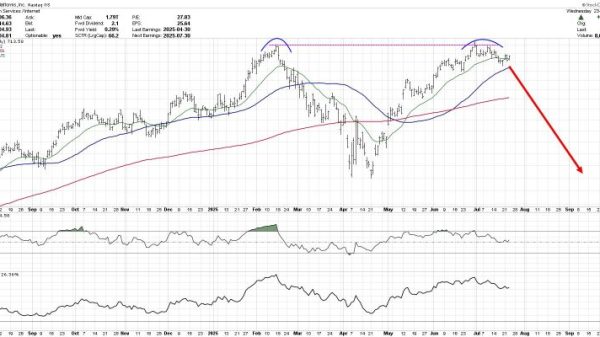
Finally, we can look what I call the “Newer Dow Theory,” an adaptation of Charles Dow’s foundational work relating the movements of two major equity indexes. While Dow used the Dow Transports and Dow Railroads to gauge economic strength, I like to consider an equal-weighted S&P 500 and equal-weighted Nasdaq 100 to compare the performance of “old economy” versus “new economy” names.
Over the last six weeks, while the S&P 500 itself has stalled out around the 5650 level, the Invesco S&P 500 Equal Weight ETF (RSP) has actually achieved a new all-time high. At the same time, the Direxion Nasdaq 100 Equal Weighted ETF (QQQE) has actually displayed a lower peak. Dow called this configuration a “bearish non-confirmation,” where a new high from one index was not confirmed by the price action of another. And this bearish non-confirmation is a common feature of major market peaks.
As a trend-follower, I would argue that the primary trend in the S&P 500 remains bullish as long as the index remains above the August swing low around 5200. But given the growing signs of deterioration in these key macro charts, the likelihood of further downside in September feels very real.
RR#6,
Dave
P.S. Ready to upgrade your investment process? Check out my free behavioral investing course!
David Keller, CMT
Chief Market Strategist
StockCharts.com
Disclaimer: This blog is for educational purposes only and should not be construed as financial advice. The ideas and strategies should never be used without first assessing your own personal and financial situation, or without consulting a financial professional.
The author does not have a position in mentioned securities at the time of publication. Any opinions expressed herein are solely those of the author and do not in any way represent the views or opinions of any other person or entity.