


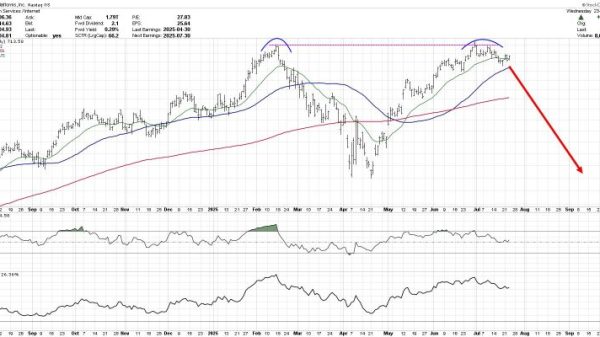


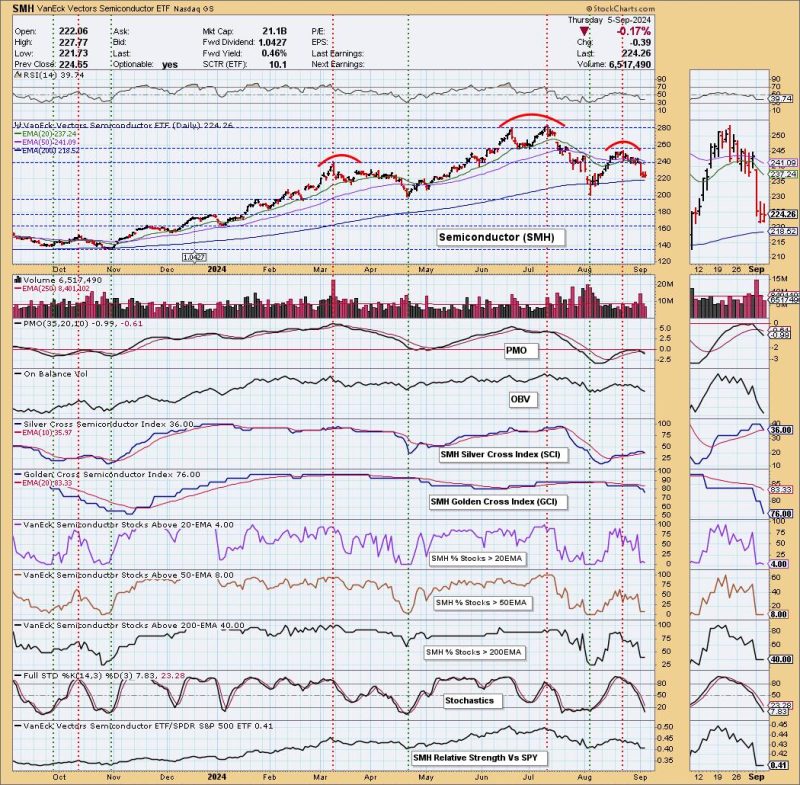
We are always on the lookout for chart patterns. Recently, we’ve found a bearish head-and-shoulders developing on Semiconductors (SMH).
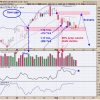
Looking at the daily chart below, we can see the pattern developing. However, we do have to point out participation. Note the very low percentages on %Stocks > 20/50EMAs. These are clearly oversold readings and, if we look back at the vertical green lines that mark cardinal price bottoms, you’ll note they were at these levels. One thing to keep in mind is that oversold conditions can persist in a bear market. SMH is down over 20% from the July top, so we could see low readings for some time.
The Silver Cross Index is about to see a Bearish Shift across the signal line, and that would give us a Bearish Bias in the intermediate term. It is already at a very low 36% reading, suggesting how unhealthy this group is.
This head-and-shoulders pattern looks dangerous. Textbooks tell us that a break below the neckline would imply a downside move that is the height of the pattern. That would take price back down to 120.00. We doubt that will happen, but 160.00 doesn’t seem out of the question if this pattern executes.
Conclusion: Semiconductors (SMH) are in a bear market and are now forming a bearish head-and-shoulders pattern that would imply a drop well below 160.00. Given participation readings are very oversold, we aren’t so sure it will see that kind of devastation, but we definitely should be prepared for more downside from this group.
Introducing the New Scan Alert System!
Delivered to your email box at the end of the market day. You’ll get the results of our proprietary scans that Erin uses to pick her “Diamonds in the Rough” for the DecisionPoint Diamonds Report. Get all of the results and see which ones you like best! Only $29/month! Or, use our free trial to try it out for two weeks using coupon code: DPTRIAL2. Click HERE to subscribe NOW!
Learn more about DecisionPoint.com:
Watch the latest episode of the DecisionPointTrading Room on DP’s YouTube channel here!
Try us out for two weeks with a trial subscription!
Use coupon code: DPTRIAL2 Subscribe HERE!
Technical Analysis is a windsock, not a crystal ball. –Carl Swenlin
(c) Copyright 2024 DecisionPoint.com
Disclaimer: This blog is for educational purposes only and should not be construed as financial advice. The ideas and strategies should never be used without first assessing your own personal and financial situation, or without consulting a financial professional. Any opinions expressed herein are solely those of the author, and do not in any way represent the views or opinions of any other person or entity.
DecisionPoint is not a registered investment advisor. Investment and trading decisions are solely your responsibility. DecisionPoint newsletters, blogs or website materials should NOT be interpreted as a recommendation or solicitation to buy or sell any security or to take any specific action.
Helpful DecisionPoint Links:
Price Momentum Oscillator (PMO)