


After a week of wavering action, the stock market made a directional move—a lot lower—after Friday’s jobs data. Investors are concerned about the economy, and the narrative has switched from inflation worries to thinking that perhaps the Fed is too late in cutting rates. Today’s MarketCarpet shows a lot of red.
It will be interesting to see how much the Fed cuts interest rates in their September meeting. As of this writing, the probability of a 25-basis point interest rate cut is 71%, with a 50-basis point probability lowering to 29%. Will this change if next week’s August inflation data comes in cooler than expected? That remains to be seen. In the meantime, let’s see how much damage occurred in equities.
Analyzing the Stock Selloff
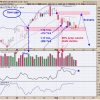
The S&P 500 ($SPX) was holding on to the support of its 50-day simple moving average (SMA) until Friday, when it plunged toward its 100-day SMA. The stochastic oscillator has also entered oversold territory, so watch this level to see how long it stays at this level.
CHART 1. S&P 500 SELLOFF SENDS THE INDEX TOWARD ITS 100-DAY MOVING AVERAGE. Keep an eye on the stochastic oscillator or any other momentum indicator.Chart source: StockChartsACP. For educational purposes.
Is this a case of too much too quickly? It may seem that way, but if you’ve been investing for a while, you know that when the market is overextended, a quick and dirty selloff happens.
Big Tech stocks got slammed. Tesla (TSLA), one of the stronger performers this week, gave up most of those gains, falling over 6%. The rest of the Mag 7 stocks—Apple (AAPL), Amazon (AMZN), Alphabet (GOOGL), Microsoft (MSFT), Nvidia (NVDA), and Meta Platforms (META)—got slammed as well.
Broadcom (AVGO) sold off after announcing earnings on Thursday after the close, which may have added more fuel to the fire in the semiconductor selloff.
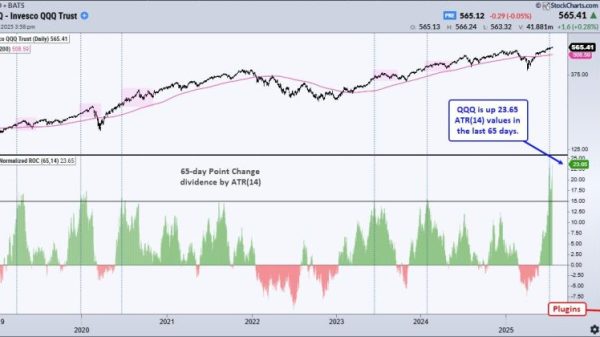
The daily chart of the VanEck Vectors Semiconductor ETF (SMH) clearly shows a downtrend. If the next low takes out the August low, the downtrend will be confirmed.
CHART 2. SEMICONDUCTORS GET SLAMMED. A downward sloping trend, dip in the SCTR score, weakness in MACD, and declining relative performance with respect to the S&P 500 point to weakness in semis.Chart source: StockChartsACP. For educational purposes.
The StockCharts Technical Rank (SCTR) score dropped to single digits after enjoying a position above 90 for an extended period. SMH closed below its 200-day SMA, the Moving Average Convergence/Divergence (MACD) is turning lower with the MACD line crossing below the signal line, and the ETF’s relative performance with respect to the S&P 500 is falling. The technical picture is not pretty.
Bonds, Oil, Crypto
After the jobs report, Treasury yields dropped, with the 5-year yield lower by 1.44%, 10-year lower by 0.56%, and the 30-year lower by 0.07%. For the 5- and 10-year Treasuries, these are the lowest levels in a year.
Commodities also suffered, especially crude oil, which has been sliding since April. The United States Oil Fund (USO) may not have hit its yearly low like the crude oil futures, but it is getting close.
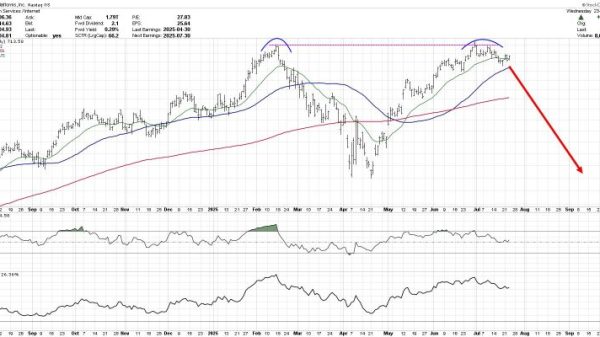
Bitcoin ($BTCUSD) is close to the lower channel of its gently sloping downtrend (see chart below). A break below this channel (dotted blue lines) could send the cryptocurrency towards 50,000 or lower. With the MACD showing weakening momentum, further decline is likely.
CHART 3. A BREAK BELOW THE LOWER TRENDLINE COULD SPELL TROUBLE FOR BITCOIN. If Bitcoin shows further weakness, it could fall much lower.Chart source: StockChartsACP. For educational purposes.
One chart I’ll be watching closely is the CBOE Volatility Index ($VIX). On a significant selloff day, I expected VIX to spike as much as it did on August 5. That it didn’t could mean more volatility lies ahead. This could send the VIX higher and higher, and might be a warning signal of further selling. That makes this something to watch very closely.
Why is the US dollar up? That’s a big question mark and something to ponder over the weekend as we prepare for next week’s inflation numbers. Expect more choppiness next week.
End-of-Week Wrap-Up
S&P 500 closed down 4.25% for the week, at 5408.42, Dow Jones Industrial Average down 2.93% for the week at 40,345.41; Nasdaq Composite closed down 5.77% for the week at 16,690.83
$VIX UP 12.46% for the week closing at 22.38
Best performing sector for the week: Consumer Staples
Worst performing sector for the week: Technology
Top 5 Large Cap SCTR stocks: Insmed Inc. (INSM); Cava Group (CAVA); FTAI Aviation Ltd. (FTAI); SharkNinja, Inc. (SN); Coca-Cola Consolidated (COKE)
On the Radar Next Week
August Consumer Price Index (CPI)
August Producer Price Index (PPI)
August Export and Import Prices
September Preliminary Michigan Consumer Sentiment
Disclaimer: This blog is for educational purposes only and should not be construed as financial advice. The ideas and strategies should never be used without first assessing your own personal and financial situation, or without consulting a financial professional.