Over the past trading week, it was expected that while technical pullbacks in the markets may get extended, NIFTY may still continue to remain under corrective pressure at higher levels. The past trading days precisely witnessed this scenario. The markets initially extended their technical pullback and extended their upmove; however, at the same time, the last trading day of the week saw the markets coming under strong selling pressure. While the NIFTY oscillated in a 427-point range, a sharp decline in volatility was notable on a technical front. The India VIX came off by another 18.82% to 10.93. The headline index NIFTY 50 closed with a net weekly gain of 272.95 points (+1.23%).
We have a truncated week coming up once again with Wednesday (May 01) being a trading holiday on account of Maharashtra Day. The markets have largely remained in a defined trading range with the 20-week MA which is currently placed at 21994 acting as immediate support on a closing basis. On the upper side, the previous week’s high shall continue to post strong resistance. In a nutshell, so long as the Nifty can defend the 21950-22000 levels, it will stay in a range; a violation of this support zone will invite incremental weakness in the markets.
The coming week is likely to see the levels of 21615 and 21730 acting as resistance points. The supports come in at 22100 and 21900 levels.
The weekly RSI stands at 64.98; it stays neutral and does not show any divergence against the price. The weekly MACD is bearish and trades below its signal line. A Spinning Top occurred on the candles; this denotes indecisiveness among market participants. The Bollinger bands are seen narrowing; this is due to the reduced volatility over the past weeks and this will contribute to keeping the markets in a narrow and defined range.
The pattern analysis of the weekly chart shows that the 20-week MA, which is placed at 21994 is the most immediate support for Nifty on a closing basis. A violation of 21950-22000 may bring in some more weakness in the index. The markets remain vulnerable to selling pressure at higher levels; no runaway upmove is likely until the Nifty crosses above the 21650-21700 zone convincingly.
All in all, we may continue to see the markets remaining in a defined trading range with the zone of 21950-22000 acting as immediate support. Importantly, the low levels of VIX would require the market participants to stay cautious of any spike on this front as may adversely impact the markets. It is worth noting that low levels of VIX are due to reduced volatility, and this reflects complacency on the part of market participants. Often major market tops are formed when VIX stays at its lowest levels for a prolonged period. In the present situation, it is of paramount importance that unless the Nifty forms a new high, we should be using all up moves to protect profits at higher levels vigilantly. All fresh purchases must be made in the defensive pockets or in those stocks that are enjoying strong relative strength against the broader markets. Overall, a cautious approach is advised of the upcoming truncated week.
Sector Analysis for the coming week
In our look at Relative Rotation Graphs®, we compared various sectors against CNX500 (NIFTY 500 Index), which represents over 95% of the free float market cap of all the stocks listed.
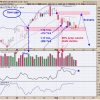
Relative Rotation Graphs (RRG) show that Nifty Metal, Consumption, and Auto Indices are inside the leading quadrant. Among these, though the Auto index is showing paring of its relative momentum, these groups are likely to relatively outperform the broader Nifty 500 index.
The Nifty Commodities, Pharma, PSU Banks, and Infrastructure indices have entered the weakening quadrant. The Nifty Realty, Energy, Midcap 100, and PSE indices are also inside the weakening quadrant. Individual performance may be seen within these groups but their relative performance is expected to slow down.
The Nifty Media Index is inside the lagging quadrant along with the FMCG Index and both groups are showing sharp improvement in their relative momentum against the broader markets. The Nifty IT Index continues to languish inside the lagging quadrant.
The Nifty Financial Services, Services Sector, and Bank indices are inside the improving quadrant; they may be seen building up on their relative performance against the broader markets.
Important Note: RRG charts show the relative strength and momentum of a group of stocks. In the above Chart, they show relative performance against NIFTY500 Index (Broader Markets) and should not be used directly as buy or sell signals.
Milan Vaishnav, CMT, MSTA
Consulting Technical Analyst


