


Tech stocks were hit with selling pressure to start the year, but many are still in long-term trends and some are nearing support-reversal zones. In particular, Apple (AAPL) fell to a support-reversal zone and I am on alert for a bounce. Let’s investigate.
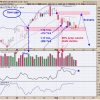
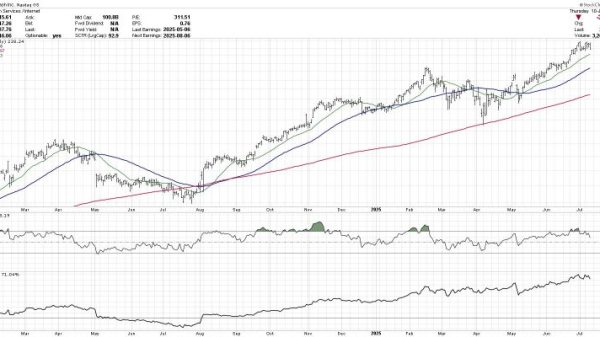
First, the long-term trend is up because APPL broke out of a falling wedge in early October and hit a 52-week high in mid December. The stock fell from these highs and is currently trading in a support zone. A classic tenet of technical analysis is that broken resistance turns support. The wedge line and October high mark resistance. Strengthening demand (buying pressure) produces the breakout and breakout zones become future support because of residual demand (blue shading).
Chartists can use retracements to identify potential reversal zones. The current decline retraced 50-61.8 percent of the prior advance (late October to mid December). Charles Dow suggested that counter-trend moves typically retrace one to two thirds of the prior move with fifty percent representing the base case. Think of this as two steps forward and one step backward. APPL is in a retracement zone that could lead to a short-term reversal.
Apple is also short-term oversold and this increases the odds for a bounce. The indicator window shows the Momentum Composite, which is part of the TIP Indicator Edge Plugin for StockCharts ACP. This indicator aggregates signals in five momentum oscillators and it reached -5. This means all five indicators are oversold. I consider the indicator oversold when it hits -3 or lower (blue line).
Apple is oversold and trading in a support-reversal zone. All we need now is a short-term upside catalyst. Chartists can use intraday charts or candlesticks to time a short-term reversal. We can also use an indicator that measures the momentum of momentum. This section will continue for members of TrendInvestorPro.
The Chart Trader offering at TrendInvestorPro provides broad market analysis and carefully curated trading setups for stocks and ETFs. Reports are published every Tuesday and Thursday before the open and each report includes a video. Click here to learn more.
//////////////////////////////////////////////////