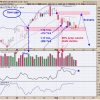
Big tech earnings week kicks off with Google parent Alphabet, Inc. (GOOGL) reporting on Tuesday after the close. More recently, the AI boom has been the biggest driver of the stock market, so that could be the main focus, as the big tech companies report. GOOGL has invested significantly into AI and will likely make it central to their search capabilities. Investors will be listening to how the company’s investments could pay off.
When GOOGL opens its books on Tuesday after the market close, investors will be closely listening for guidance, especially in the AI front. Analysts expect EPS of $1.45 and revenues of $75.94 billion. A lot is riding on GOOGL’s earnings report, and the results could push the stock price in either direction. A positive earnings report could send GOOGL’s stock price close to or above its all-time high. If earnings miss expectations, the stock price could see a significant fall.
GOOGL Price Chart: A Weekly Perspective
Google’s stock price has been trending higher in 2023 and is trading pretty close to its 52-week high. The Distance To 52-Week High is at 1.41%. When you look at the weekly chart of GOOGL stock, it’s clear that it was in a strong uptrend from April 2020 to November 2022. Since then, the stock went through a reversal and trended lower. But GOOGL has recovered from the downtrend and trended higher in 2023 (see chart below).
CHART 1: WEEKLY CHART OF GOOGL STOCK. Although the stock has been trending higher for 2023, its Q3 earnings report can have a significant impact on the price action of Google’s stock. Chart source: StockChartsACP. For educational purposes.
On the weekly chart, the 23.6% and 38.2% Fibonacci retracement levels coincide with the 21-week exponential moving average (EMA) and the 50-week simple moving average (SMA), respectively, critical support levels to watch.
GOOGL Price Chart: Daily Price Action
Switching to a daily chart of GOOGL (see chart below), you can see that GOOGL stock is holding support at the 50-day SMA. If earnings beat expectations and the company has a strong outlook on AI, the stock price could go higher.
CHART 2: DAILY CHART OF GOOGL STOCK. The daily chart shows a high SCTR score and a rising RSI. Both indicate strength in the stock. Let’s see if GOOGL’s Q3 earnings report sends this stock higher. Chart source: StockChartsACP. For educational purposes.The daily chart is showing strength. The stock bounced off its 50-day SMA and is trading above its 21-day EMA. The StockCharts Technical Rank (SCTR) is registering at around 95, which indicates the stock is strong. The relative strength index (RSI) is around 56, which suggests the stock has upside room if earnings are strong.
Google’s stock price today is trading higher, but investors are probably waiting to hear what the company says in their earnings conference call before buying more shares.
If earnings beat and guidance is positive, and the stock trends higher, look for a close above the October 12 high of $141.22. This would be a higher high, a requirement to seal the uptrend.
If, on the other hand, GOOGL reports disappointing earnings, the stock price could fall significantly. A drop below the September 26 of $127.22 would bring the stock price to a lower low, which would be an indication of a downtrend.
Take a deep breath and wait for the 4:00 PM showdown. After-hours trading action should be interesting.
Disclaimer: This blog is for educational purposes only and should not be construed as financial advice. The ideas and strategies should never be used without first assessing your own personal and financial situation, or without consulting a financial professional.


