We are already in October …. How did that happen?
Also, I am writing this article while sitting in a Starbucks in Jakarta, Indonesia. The combination of the hotel, the Starbucks, the internet, and me have not been very successful so far Recording a Sector Spotlight show will therefore be pretty much impossible.
However, we are once again at the start of a new month, and thus ending the previous month, which means looking at seasonality and monthly charts.
Given the situation, I will attack both items in articles rather than on video. Starting with seasonality.
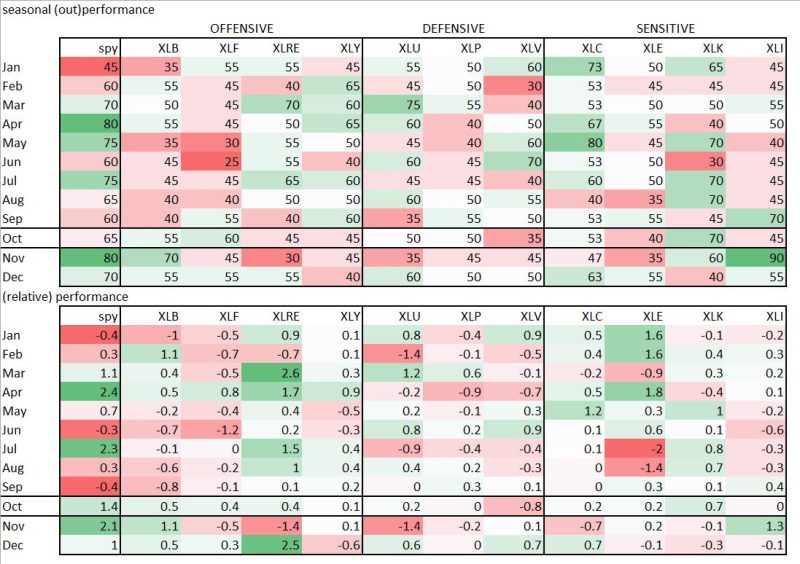
The table above shows the seasonality data as I always use it in Sector Spotlight.
After September living up to the expectation of being a weak month for the market, the S&P was down almost 5% vs. the seasonal average of minus 0.4%, we are now entering the strongest period of the year.
In the top half of the table, you see the percentage of time (last 20 years) that a sector has outperformed SPY. For SPY itself it is the percentage of time where SPY closed the month higher than it opened. So 65% of the time, SPY closed the month of October higher than it started.
In the bottom half of the table is the average performance relative to SPY. For SPY it is the outright average performance. 1.4% for October.
Sneak peeking ahead shows that November and December are, historically, expected to be even stronger.
Going over the relative performances for the sectors shows strong expectations for Technology 70% and Financials 60% and a weaker outlook for Health Care 35% and Energy 40%.
Following the expected relative performances in the bottom half, Technology is expected to outperform SPY by 0.7%, and Financials 0.4%.
Health Care is expected to underperform 0.8%. Energy is the odd one out, the average (expected) performance for this sector over the last 20 years is 0.2% over SPY. In combination with outperformance in October in only 40% of the time, this means that WHEN Energy outperforms the market it is outperforming very strongly.
Current Rotation
The RRG above shows the current rotation for US sectors.
Technology is inside the weakening quadrant but has already started to pick up relative momentum, a continuation of this rotation could bring XLK back towards the leading quadrant and thus maintain a leading role within SPY.
Financials has entered the leading quadrant from improving but is losing relative momentum. Relative strength needs to improve rapidly for this sector in order to keep the relative uptrend and live up to the seasonal expectation.
Health Care is inside the improving quadrant but seems ready to roll over and start heading back down toward lagging, which would be fully in line with the seasonal expectation.
Energy, finally, is the strongest sector in terms of RS-Ratio at the moment. This definitely does not align with the seasonal expectation for an underperformance but it DOES align with the observation that WHEN Energy outperforms in October it outperforms strongly.
Information Technology (70%/+0.7%)
The price chart for XLK certainly got damaged last month but on a relative basis it is still holding up well. The raw RS-Line is moving sideways while the JdK RS-Momentum line is digesting the recent decline and starting to move upward.
The recent bounce off of support in the price chart will help relative strength to maintain current levels and potentially improve further. An upward break of relative strength out of its small consolidation will very likely be the trigger for a renewed period of outperformance and bring XLK back into the leading quadrant.
Financials (60%/+0.4%)
Following the recent break below its previous low on the price chart, XLF has now started a new series of lower highs and lower lows. This will make it difficult for relative strength to hold up at current levels. The lack of relative momentum (JdK RS-Momentum) is already showing up.
This makes it doubtful whether XLF will be able to live up to its positive seasonal expectation for October.
Health Care (35%/-0.8%)
The healthcare sector is struggling. On the price chart, the last two rallies did not manage to reach the resistance area around 140 and at the moment the price is testing the upward-sloping support line for the fourth time. A break below this line will confirm underlying weakness and very likely trigger more downside movement. When that happens all previous lows will potentially act as support on the way down.
With JdK RS-Ratio still well below 100 and JdK RS-Momentum rolling over it looks as if the tail is ready to roll over and head back toward the lagging quadrant on the RRG.
This rotation would be in line, and confirm, the expected seasonal weakness for this sector.
Energy (40%/+0.2%)
The Energy sector seems to be at a crossroads, pretty much as suggested by the seasonality pattern.
The sector historically only outperforms 40% of the time, meaning that it underperforms 60% of the time. But the average relative return for October is at +0.2%. As said above this means that if and when the sector outperforms in October it will outperform strongly. Otherwise, there would not be a +0.2% average relative performance against SPY.
Looking at the price chart we see XLE pushing against overhead resistance but so far not being able to break it. Raw RS managed to get out of a small falling channel but is now running into trouble to push higher.
Hence with the price just below resistance and RS on the verge of rolling over, I can now see two scenarios for XLE.
The first is in line with the seasonal pattern. Ie an underperformance vs SPY. when the price will not be able to break resistance and the rally in RS stalls. The expected (out)performance in that case will be around 0-0.2%, in line with the market.
In the second scenario, XLE will break above resistance and accelerate higher in price which will then drag relative strength higher and push XLE deeper into the leading quadrant.
A make-or-break situation therefore which relies on the breaking of resistance.
All in all, the tails for Technology, positive, and Healthcare, negative, seem to be best positioned to follow their seasonal expectation. Financials not so much and Energy will very likely either go nowhere or, in case of a break, rally significantly relative to SPY.
#StayAlert, –Julius


