


Energy-related Commodities Lead, but Oil Looks Vulnerable
It has been a rough ride for most commodities this year and especially over the last 100 trading days (since May). Of the twelve spot prices I track, nine are up and three are down. Precious metals, base metals, lumber and grains are all down. The energy complex is the only gainer since May. Oil is up over 15%. Even though oil is leading, it hit an overbought extreme and looks vulnerable to a pullback.
As an aside, there is an old saying that the cure for high oil prices is high oil prices. In other words, demand will wane as prices climb and supply will eventually exceed demand. The same is perhaps true for inflation. The cure for high inflation is high inflation. Demand will wane as prices climb and consumers cut back on spending. This drop in demand is what will ultimately cure inflation.
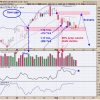
The chart below shows USO becoming overbought in July-August and even more overbought in September. . Yes, there is overbought and then there is OVERBOUGHT. RSI exceeded 70 in late July and early August. This is the garden variety overbought reading. It then exceeded 80 in mid September. This creates an exceptionally overbought condition that could lead to a pullback. USO and two energy ETF were covered in Thursday’s Chart Trader report and video
Where might USO find support? USO was up some 37% from the June low to the September high. A 50% retracement of this move would extend to the 70 area. The blue shading marks a prior resistance zone in the low 70s and this is also a target for a pullback. Taken together, I would suggest a zone in the 70-73 area for a pullback.
I covered USO and two energy ETFs in Thursday’s Chart Trader report and video. This report summarized the bearish evidence for stocks and put forth downside targets for SPY and QQQ. Three bearish stock ideas were also presented with downside targets. Click here to learn more and gain immediate access.
The TIP Indicator Edge Plug-in for StockCharts ACP has 11 indicators to enhance your analysis and trading. These include the Trend Composite, Momentum Composite and ATR Trailing Stop. Click here to learn more.
—————————————